We used the TEM45 model to determine the energy and carbon sequestration consequences of biofuel production in the U.S. We examined maize and switchgrass, a perennial tallgrass, for ethanol production, assuming conventional starch fermentation for maize and cellulosic ethanol conversion for switchgrass. We also examined soybean for biodiesel production. We developed parameterizations of maize and soybean based on data from the Kellogg Biological Station in Michigan, and a parameterization for switchgrass based on data from a tallgrass prairie site in Osage, Oklahoma. In the experiments, we simulate a) all cropland as corn, both fertilized and unfertilized, b) all cropland as fertilized soybean, and c) all grassland that is not in crops as switchgrass, both fertilized and unfertilized. We then determined the total crop yield of corn, soy, and switchgrass in all five cases and used data from the literature to convert the yields to energy input and output as well as emissions abatement (Table 1). For the switchgrass, we considered the carbon sequestration produced by converting the native grassland (parameterized by the shortgrass prairie at Pawnee National Grassland in CO) to switchgrass cultivation. Note that the energy inputs assume an “island economy” and include costs like seeds, farm energy, fertilizers and pesticides, farm machinery, farm capital, crop conversion, construction, labor, and transportation. Typical coproducts include distillers dry grain with solubles from maize, and soybean meal and glycerol from soybean. Finally, Melillo et al. (2009) explored the effect of converting land to crops for biofuels on a global basis.
Table 1: Energy conversion factors
| Energy in (MJ/I) | Energy Out (MJ/I) | Coproducts (MJ/I) | Mass to Vol. (I/kg) | Emissions Avoidance (gC/MJ) | |
| Maize | 20.39(1) | 21.26(1) | 4.31(1) | 0.38(3) | 3.28(1) |
| soybean | 28.38(1) | 32.93(1) | 21.94(1) | 0.23(4) | 9.09(1) |
| switchgrass | 5.49(2) | 21.26(1) | 1.96(2) | 0.255(2) | 20.2(2) |
1 (Hill et al., 2006)
2 (Tilman et al., 2006)
3 (Shapouri et al., 1995)
4 https://fapri.missouri.edu/outreach/publications/2006/biofuelconversions.pdf (expired link)
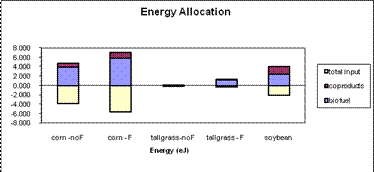
The energy allocation (Figure 1, Table 2) shows the largest net energy gains for the fertilized crops, with 1.96 EJ yr-1 for soy, 1.42 EJ yr-1 for fertilized maize, and 1.11 EJ yr-1 for fertilized switchgrass. The net energy gains approach 1 EJ yr-1 for unfertilized maize, but are inconsequential for unfertilized switchgrass. By comparison, in the U.S., the transportation sector alone consumes about 28 EJ yr-1(Energy Information Administration). Although fertilized switchgrass has less net energy gain than maize or soybean, it also has significantly less energy input demands, and the ratio of biofuel output to coproduct output is the highest.
Table 2: Energy Allocation (EJ yr-1)
| Fert | No F. | |||||||
| Input | OutBio | OutCo | Net | Input | OutBio | OutCo | Net | |
| maize | -5.58 | 5.82 | 1.18 | 1.42 | -3.80 | 3.97 | 0.80 | 0.97 |
| soybeans | -2.10 | 2.43 | 1.62 | 1.96 | ||||
| switchgrass | -0.32 | 1.25 | 0.11 | 1.04 | -0.03 | 0.11 | 0.01 | 0.09 |
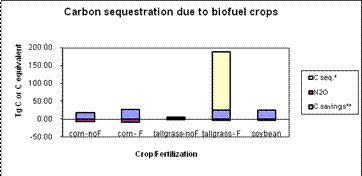
Greenhouse gas savings arise because growing crops take up the carbon released during combustion. The carbon sequestration resulting from land use conversion is significantly larger than the gains due to greenhouse gas savings for fertilized switchgrass (Figure 2, Table 3), because enhanced productivity and root turnover allow for more soil carbon storage in fertilized grassland than non-fertilized grassland. Even discounting the effects of land conversion, fertilized switchgrass allows for a larger reduction of emissions than the other crops due to the much lower required inputs and the higher efficiency of the cellulosic ethanol conversion. The transportation sector in the U.S. currently emits over 518 Tg C yr-1(Energy Information Administration).
Table 3: Carbon Sequestration (TgC yr-1)'
| Fert | No F. | |||||||
| Input | OutBio | OutCo | Net | Input | OutBio | OutCo | Net | |
| maize | -5.58 | 5.82 | 1.18 | 1.42 | -3.80 | 3.97 | 0.80 | 0.97 |
| soybean | -2.10 | 2.43 | 1.62 | 1.96 | ||||
| switchgrass | -0.32 | 1.25 | 0.11 | 1.04 | -0.02 | 0.11 | 0.01 | 0.09 |
BioFuels


